We never found explicit formulas for the functions s[t] and i[t] of the epidemic model of Chapter 2, and this project shows how you can find max-min information anyway.
The epidemic model of Chapter 2 is given by the system of differential equations

 and
and
 . Typically, the initial i[0] is small and s[0] is large but not 1 unless no one has ever had the disease.
 . What calculus criterion is needed?
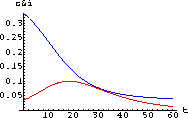
There are two `peaks' of interest in an epidemic. 1) When are the most people sick? 2) When is the disease spreading fastest? The second peak could mean either that the rate of contracting new cases is largest or that the growth in the infectious population is largest. These are different.
Before you begin, review the mathematical ideas needed to find the maximum of a function defined on the interval
 . You need to apply the theory to three functions, i[t], f[t]=as[t]i[t], and
 .
.

 .
.
For example, the function i[t] has a "typical" slope table, "up"-"over"-"down."


 . Show that the variable increases before your condition and decreases afterward.
Consider various cases of c and initial conditions in s and i including "extreme" cases such as c very big and very small or s[0] very big or very small. (Note: c=15 for measles and c=4.6 for polio. Nearly everyone is susceptible if s[0]=0.9.) When s[0]<1/c, when does the i[t] "peak"?
 , we need to find zeros of its derivative

The previous peak does not take the daily recovery rate into account.
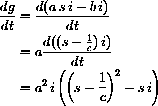
 . Show that the derivative of g[t] is:
This equation is hard to analyze, but we can use the invariant from Chapter 2,


Discuss various cases of the value of c and the initial values of s and i.

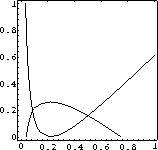
We can also modify the SIRsolver program to plot the expressions for f'[t] and g'[t] in various special cases.


These graphs should help you make slope tables for f[t] and g[t] at least in these special cases. (Look at the signs of f'[t] and g'[t] on the graphs.) Of course, you could also graph f[t] and g[t] themsleves.
Problem 5.1
Use the program SIRsolver or SIRmaxHelp from our website to examine the three "peaks" of various epidemics. When do they occur? How do the disease parameters b and c affect the peaks and times of occurrence? How do the initial values of s[0] affect the peaks and times?