We will make the following basic assumptions:
- 1.
SIS: Individuals all fit into one of the following two categories:
- Susceptible: those who can catch the disease
- Infected: those who can spread the disease *Note: There are no removeds who are immune and cannot spread the disease.
- 2. The population is large but fixed in size and confined to a well-defined region. We imagine the population to be in a large public university during the semester when relatively little outside travel takes place.
- 3.
The population is well mixed; ideally, everyone comes in contact with the same fraction of people in both categories every day.
Again, imagine the multitude of contacts a student makes daily at a large university. (This assumption does not work well for gonorrhea - see below.)
Gonorrhea is an S-I-S disease, but it is not well modeled by simple single compartments for susceptibles and infectives. The added concept of a "core" group is needed to build accurate models. See the book Gonorrhea Transmission Dynamics and Control by H. W. Hethcote and J. A. Yorke, Springer Verlag Lecture Notes in Biomathematics, vol.56, 1984, if you wish to study that disease.
In order to build a model that makes predictions for all large well-mixed populations, we make our main variables the continuous fractional variables similar to the ones in Chapter 2 of the core text.
4.2
The Continuous S-I-S Variables 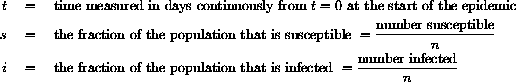
where n is the (fixed) size of the total population. Note that s+i=1.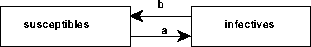
Figure 4.1: SIS Disease Compartments4.3
Parameters for the SIS Model 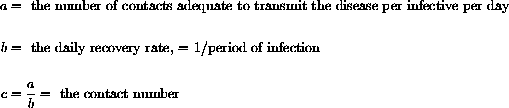
As in Chapter 2, the parameter a determines the spread of the disease in the model. A serious challenge in this project is to decide how we might measure a or the contact number
 . (This is not so hard once you figure out the limiting behavior.)
The average number of susceptibles infected by one infective is
 per day.
This is "adequate contacts times fraction of contacts susceptible." Therefore, if the entire infective class has size I, we get new infections at the rate asI per day, and since we work with the fraction of infected, this makes the rate of increase in i from new infections asi=asI/n.
per day.
This is "adequate contacts times fraction of contacts susceptible." Therefore, if the entire infective class has size I, we get new infections at the rate asI per day, and since we work with the fraction of infected, this makes the rate of increase in i from new infections asi=asI/n.
The parameter that controls how quickly people recover and become susceptible again is b. You can also think of 1/b as the average number of days an infected person remains infective. For strep throat this is 10 days, so b=0.1. As b is the recovery rate, the number of people leaving the infected compartment each day is bI and the fractional rate is bi.
Let's look at the changes affecting the infected compartment. Each day the percentage of the population leaving the infected compartment is bi and the percentage of the population that becomes newly infected is asi. The differential equation for the infecteds is thus
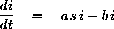
Notice that this is the same as it was for the S-I-R model and represents the arrows in and out of the infected compartment in Figure 4.1.You must now develop the differential equation for the susceptibles.
- The Rest of the Model
Give the differential equation for the rate of change of the susceptible fraction. ( Hint: Think of where the people leaving the infected compartment are going and where the ones entering the infecteds are coming from.)You could compute i without a differential equation, if you knew s. Since everyone is either susceptible or infectious, s+i=1 and i=1-s.
- Express the differential equation for s without using i?
The last hint means that you can either use the system of differential equations for both s and i or use a single differential equation for s and solve for i=1-s algebraically.
- The Computer and Your S-I-S Model
Use one of the equivalent mathematical models from the previous exercises to modify the main computation of the computer program SIRsolver to compute the course of an S-I-S epidemic. Run several test cases, say, using b=0.1 and a=0.01 and then b=0.1 and a=1.Use your program for initial experiments and later to verify conjectures.
4.4
The Importance of the Contact Ratio The contact number, c=a/b, is the average number of adequate contacts an infective person has during the whole infective period. If the contact number is large, that intuitively means that the disease spreads more easily than a disease that has a lower contact number. The exercises that follow deal with seeing how the contact number affects the behavior of the disease in the model. This will lead you to make a mathematical conjecture about the importance of c in determining whether the disease persists in the population.
Imagine the following situation. Strep throat breaks out on campus. You catch it but are determined to go to class, thereby spreading it to some of your classmates. Your classmates are likewise conscientious and in turn pass it on. You recover but sit next to a third-generation infected person and catch it again.... In this way it might be possible for a certain fraction of the population to always be sick.
- The Endemic Limit - Experiments
Use your the computer program (built from SIRsolver in the last exercise) to try to formulate some conjectures about the importance of the contact number c. It seems reasonable that if a disease has a large contact number, then everyone becomes infected. Experiment with "large" (but fixed) contact numbers. Does
Why not? We suggest that you try c=2,3,4. What does this mean in terms of spread of the disease?Also experiment with "small" contact numbers. Try
 . Be sure to compute a long time period such as a whole semester.
What are biologically reasonable meanings of "big contact number" and "small contact number"?
. Be sure to compute a long time period such as a whole semester.
What are biologically reasonable meanings of "big contact number" and "small contact number"?
If
 , what does the limit of
 have to be in your model?
You should have done enough experiments with the computer and your S-I-S model to see that for some values of c, the S-I-S disease dies out, whereas for other values of c, the disease tends to a limiting situation where it is always present. This does NOT mean that the same people are always sick. Why? This does mean that the disease is "endemic" in the population.
- Conjecture
PART 1: After you try various simulations, make a conjecture about
What do the numerical simulations do in the cases you ran when c<1?4.5
Conjectures After you try various simulations, make a conjecture about
in case c>1. This formula should be easy to guess if you have done simulations with values such as c=2,3,4 and compute your observed limit in terms of c.Once you have made clear conjectures, you should use the equations for change to show that things change in the direction of your conjecture. For example, in case you conjecture that the disease dies out, s[t] tends toward 1, so any initial condition with s0<1 should eventually result in s[t] increasing toward 1.
- Proof
In the limiting case where and
and
 , what happens to the rate of change of i with respect to t when
 ? What happens to the rate of change of s with respect to t when
 ?
? - 1. Express your answer in terms of derivatives.
- 2. Express your answer in terms of the formula for derivatives given by the model.
- 3.
Solve the second expression for s=?
Suppose that you happened to start the solution of your model differential equation with
 , the limiting value.
What would happen? What does this mean in terms of your differential equations?
, the limiting value.
What would happen? What does this mean in terms of your differential equations?
Prove your experimental conjecture mathematically and say how the contact number determines whether or not an S-I-S disease will be endemic.
What happens if s is greater than the third expression?
What happens if s is smaller than the expression?
What happens if s cannot be greater than the last expression? (Recall that s is a fraction, so that
 .)
.)
Summarize your results as a completely stated theorem, something like, "An S-I-S disease approaches an endemic limit,
 , provided the contact number .... " Beginning at any fraction of susceptibles s[0] between zero and one, the limiting behavior is for
 and
and
 .'
.'
4.6
Conclusions If you knew that an S-I-S disease was endemic and you knew the period of infectiousness, 1/b, how could you measure the parameters a and c?
Now that you have explored the effects of the contact ratio on the long-term behavior of the disease, what could be done to help control the disease? What policies could be implemented by Student Health, for example, to help keep students infected with strep throat from becoming endemic? Say how the health policy decision would affect the parameters of your model and how much the effect would need to be to prevent endemic presence of the disease.
Problem 4.1 Extensions of the S-I-S Model (optional)
If a person with strep throat receives antibiotic treatment, after a day he is no longer infectious. On the other hand, he is not susceptible either. How would antibiotic treatment at an average of 3 days after infection change your model? How does the endemic limit theorem work in your new model?
Previous project Next project Close this window - The Rest of the Model