VARIABLES:
- 1. t = time in weeks
- 2. x = density of rabbit pairs per square mile
- 3.
y = density of weasel pairs per square mile
PARAMETERS:
- 1. a = the intrinsic per capita growth rate of the rabbits (1/time)
- 2. b = the predator's effectiveness in terms of prey capture
- 3. c = the predator's intrinsic death rate (1/time)
- 4. e = the predator's efficiency in terms of prey consumption
- 5.
f = the gathering effectiveness of grad students, per unit of specimen

- A Model of Bunnies, Weasels, and Grad Students
Your first task is to describe what these equations say about the interactions. Remember that poor Professor Debrainman needs clear biological descriptions. Try to be as biological as you can. We offer a start as follows.When there is no "fishing" by the graduate students, f=0, our model is the Lotka Volterra model studied in Chapter 22 of the text. The parameter a represents the intrinsic fertility of the rabbits. When y=0 and x is small, the growth of rabbits is

which says that each pair of rabbits has a babies per week. The units are "new bunny pairs per bunny pair per week." Canceling units of bunnies, we obtain a in units of "1/weeks."The term -bxy represents the hunting effectiveness of the weasels. Let us be more explicit. The units of the whole term -bxy are "(negative or captured) bunnies per unit time." If there are lots of weasels, y is big, then lots of bunnies get caught, but if there aren't many bunnies, x is small, then the hunting is tougher and fewer bunnies get caught. In other words, the whole term takes the density of rabbits and the density of weasels both into account. The units of the whole term are "bunnies per week = units of parameter b
 bunnies
 weasels," so the units of b are "bunnies (caught) per week per bunny per weasel = 1/(weasel weeks)." Your project should explain all the terms to Prof.
Debrainman and give the units as well.
In particular, explain to the professor that the success of his students depends on the densities of the two species that exist on the island.
If these are low, the students will have trouble collecting samples.
The professor is rather worried about the effect of this "fishing" on his isolated little ecosystem. By manipulating the mathematical model for this relationship, we can predict what effect the graduate students will have on the rabbit and weasel populations.
- Mathematical Experiments
Continue your project with some computer based on the Flow2D program or the Fox-Rabbit example program. We want to understand the effect of increased "fishing" on the fragile ecosystem of Bunny Island, but first you must understand the basic model. Begin your experiments with a=0.1, b=0.005, c=0.04, and e=0.00004 and no graduate students, f=0.0.Here are some basic questions about the model with these parameter values:
- 1. How often does a pair of rabbits have babies if they typically give birth to four male and four female babies?
- 2. What are the direct interpretations of the other parameters?
- 3.
You will see that there is an equilibrium of xe=1000 and ye=20 for the un-disturbed island.
Try various initial conditions, so that you can understand the nature of this equilibrium.
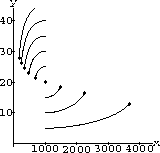
For example, what happens to the populations if there is a displacement from equilibrium, say, that the initial number of weasels is 10, 20, 30, 40 and the initial number of rabbits is 1000 in each case? A flow picture is shown in Figure 40.3.

Figure 40.1: Rabbits and WeaselsNow introduce a small amount of "fishing," f=0.05, and recompute your computer flow. What happens to the flow dynamics? What happens to the point of equilibrium?
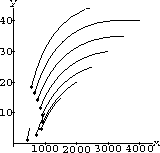
Increase the fishing to f=0.1 and compute the flow. What does the flow look like in this case? Do the weasels survive? Do the rabbits?
Let the graduate students have full rein, f=0.5. Does anything survive?

Figure 40.2: Grad Students Arrive - Mathematical Conjectures
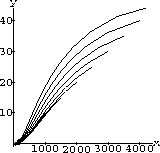
Analyze the results of your mathematical experiments and describe the effect of various amounts of fishing on this environment. We observed three rather different types of dynamics in our experiments. Experimentally, what happens as f increases?
Figure 40.3: Overfishing - Mathematical Proofs
Use the theory of Chapter 22 to formulate a mathematical explanation for the various effects of increasing the fishing f from 0 to higher and higher values. Plot the curve of the equilibrium point (xe,ye) by hand parametrically depending on the parameter f. Remember that a parametric line will have the form
when f is the parameter. Give general symbolic answers in terms of a, b, c, e, and f, so that the professor can use the results on different islands where the natural parameters may be different. Hint: Use the computer to help where convenient, for example, Solve[{ax-by-fx==0,-cy+ex-fy==0},{x,y}]What is the limit you must put on f in terms of the other parameters in order that the graduate students don't destroy one or both species?
The terms -fx and -fy represent collection of species all the time. Suppose that the graduate students only visit the island seasonally. One rough approximation for their hunting of samples might be a sinusoidal "fishing" term like

so that the captured rabbits and weasels are given by and
and
 , yielding the equations

These equations are nonautonomous, so the direction field flow analysis is not appropriate. However, explicit solutions can be used to make some experiments. - Seasonal Collection
Modify the AccDEsol program to test the effect of seasonal visits by graduate students collecting samples. In the constant sampling case, you found a threshold value for the constant f where the natural dynamics of Bunny Island changed qualitatively. Use this value for f in the seasonal sampling, and assign values of p and q so that F[0]=0, no students are on the island at midnight of a new year, and the oscillation of F[t] is completed each year. When are the most graduate students visiting Bunny Island? What is their highest rate of collection? Be sure to run your model for several years. (Recall that t is in weeks.)Does the seasonal relief from sampling allow the ecology on Bunny Island to recover?
What happens if the students visit part of each semester, instead of annually.
Bunny Island is enormous, with vast expanses of grass, seemingly with no limit to the number of rabbits it can support, but neighboring Rabbit Island is much rockier. There still are few bushes and no sparrows, but now there is a limit to the total number of rabbits it can support.
40.2
Rabbit Island Add a carrying capacity term to the rabbit-weasel equations:
and repeat the steps in the analysis of the ecosystem of Bunny Island. We observed a somewhat surprising added stability in this model. It actually seemed better able to cope with the seasonal onslaught of graduate students.- The Model
Explain the new term -ax2/k to Professor Debrainman in biological terms. For example, tell him the dynamics in the case where there are no weasels. (You might want to review the logistic equation from Chapter 22.) Give units and so forth. Why is k called the carrying capacity? How might Debrainman measure this?- Basic Experiments
Continue your project with some computer experiments based on the Flow2D program or the Fox-Rabbit example program. We want to understand the effect of increased "fishing" on the ecosystem of Rabbit Island, but first you must understand the basic model. Begin your experiments with a=0.1, b=0.005, c=0.04, and e=0.00004, no graduate students, f=0.0, and a large carrying capacity, k=5000.Gradually decrease the carrying capacity k to see how that affects the dynamics.
Finally, introduce the graduate student collection of specimens, f>0.
- Observations and Conjectures
Make some biological observations about the behavior of your new model. For example, we felt that the new island was somewhat more stable in a sense. Even after a disturbance, when left alone, things returned to equilibrium in time, at least when k was large and f was small.How small could we make k? How large could we make f?
- Proofs
Formulate mathematical criteria for where the equilibrium occurs in terms of the parameters. Use the local stability theorem of Chapter 24 of the main text to compare the stability types of the equilibria of Bunny Island with those of Rabbit Island.What is the mathematical limit on smallness of k and largeness of f after which the ecology of Rabbit Island is altered?
- Seasonal Collection
Modify the AccDEsol program to test the effect of seasonal visits by graduate students collecting samples on Rabbit Island. Be sure to watch for several years. We noticed a surprising difference between Bunny Island and Rabbit Island when we sampled seasonally with a peak near the threshold of sampling. Rabbit Island seemed better able to recover.Previous project Next project Close this window - The Model