In order to verify our model of an S-I-R disease, we need to know the proportions of a population that are susceptible, immune, and removed as functions of time in a real epidemic. It is often very hard to determine these proportions because a large number of cases of a given disease go unreported (consider how many times you've had the flu, and out of those times, how many times you actually saw a doctor and had a chance to be "counted"). For this reason, certain diseases lend themselves to study because, in one way or another, they make their presence known to the medical community. For example, polio was severe enough to require medical attention, ensuring that there would be records of most cases. The Hong Kong flu epidemic data of 1968-69 were derived from a different source.
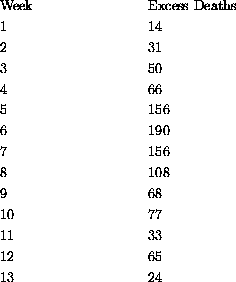
The data for the Hong Kong flu are from the medical reports of coroners in New York City. During the period of the epidemic, the disease can be traced as a function of the excess of individuals who died due to influenza-related pneumonia in the New York City area. The term "excess" in the preceding sentence refers to the fact that you expect to get a certain number of deaths. However, during the epidemic, there was a large increase in deaths which could be roughly attributed to the Hong Kong flu (due to influenza-related pneumonia). The data (from the U. S. Centers for Disease Control) follow and are also given in the computer program FluDataHelp on our website (so you don't have to retype them).
Once we have our data, the question becomes, how to compare the data to our model? There are two factors that we must consider. First, not everyone who got the Hong Kong flu died as a result. And second, those who did die probably did not do so right away, but rather had the disease for a period of time before expiring. On the basis of these two facts, then, we can hypothesize that the number of excess deaths is proportional to the number of infected individuals from a couple of weeks before.
A comparison with the model requires that we satisfy the assumptions of our model and set up the initial conditions.
The population of New York in 1968 was around 7,900,000. Because the Hong Kong flu was a new strain of influenza at the time that the data were taken, all individuals were susceptible.
Due to its great virulence, the disease doesn't require much help getting started - say 10 people who have the virus return from a visit to Hong Kong, raising the population to 7,900,010.


How well does New York City satisfy the assumptions, especially the "homogeneous mixing" assumption? Where does this enter the differential equations?
You can do computations with this model using either of the computer programs SIRsolver or FluDataHelp (from our website).
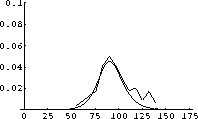
After scaling and allowing for time for the epidemic to start, we see the following superposition of model prediction and measured excess deaths shown in Figure 2.2.

Your job is to make a similar match and justify that your match verifies that the S-I-R differential equations do indeed make reasonable predictions about flu epidemics.
 . Calculate for 90 days at first, then decide whether the epidemic takes longer or shorter than 90 days.
When does the number of infectives reach its maximum?